IntPlot is a program for plotting different ED intensity functions produced by UNEX.
Binaries of IntPlot are bundled with respective versions of UNEX which can be found on the Downloads page.
Gallery
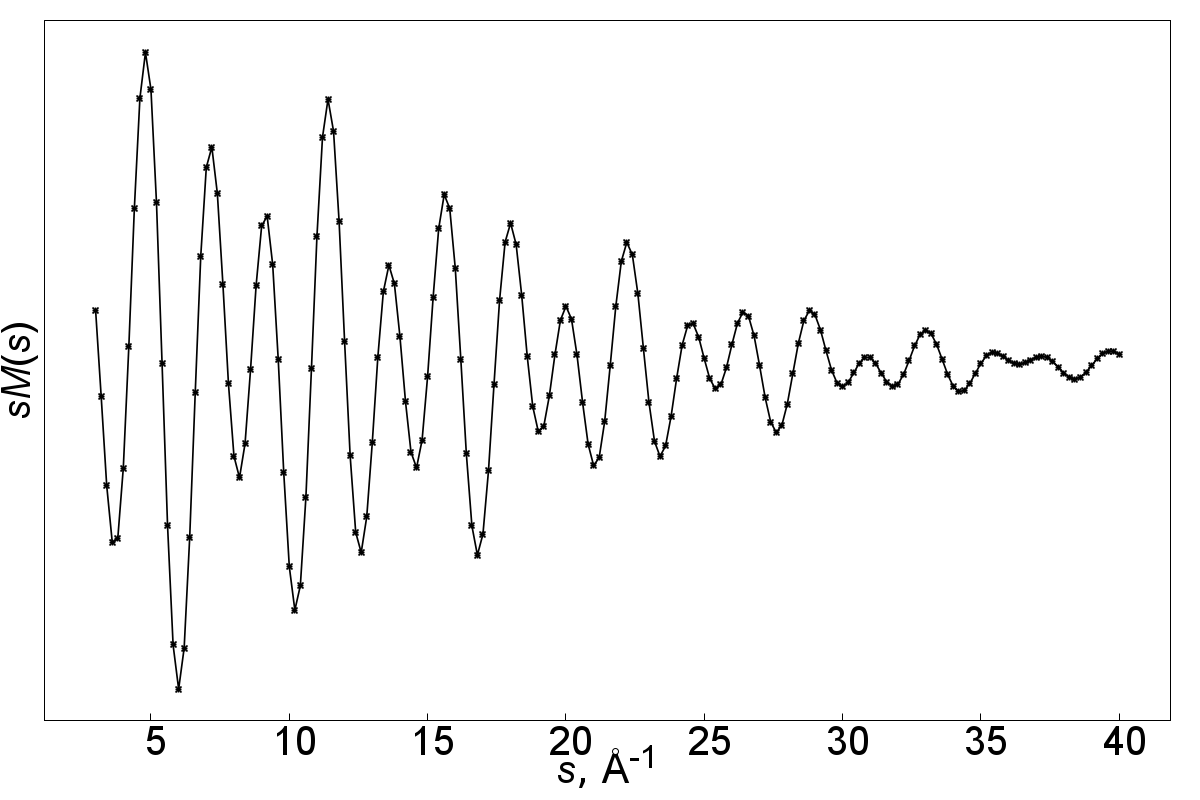
IntPlot v1.6-747. Changing style for experimental sM(s) to lines with points and type of points.
intplot --curves 3-1 --data sms --no-grid --no-ytics --no-x2tics --no-y2tics --style_sms=3 --ptype_sms=3 unex.out
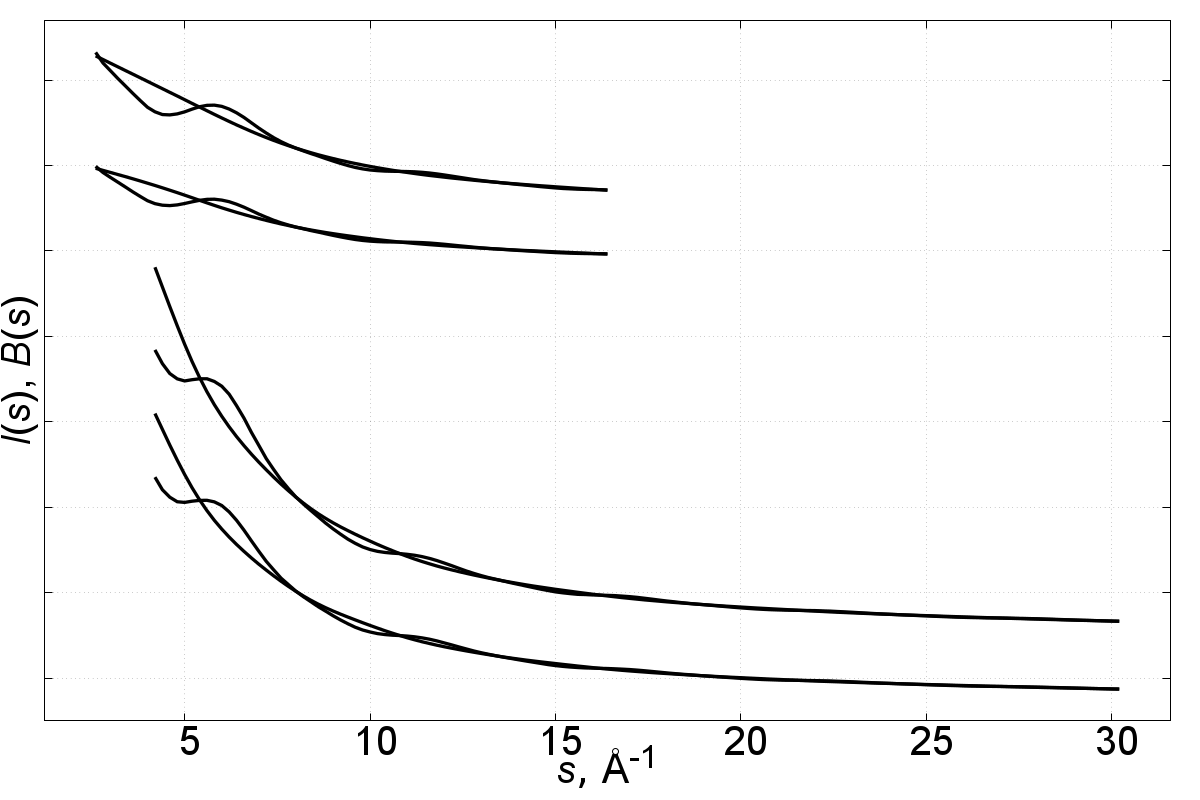
IntPlot v1.6-580. No legend by default. New options --curves and --data allow to avoid using --cread, --ccombine, --dread and --dcombine with equal arguments.
Thus, the entire command shortens to
intplot --curves 4-1,4-2,5-1,5-2 --data int,bgl --png intplot2.png unex.out
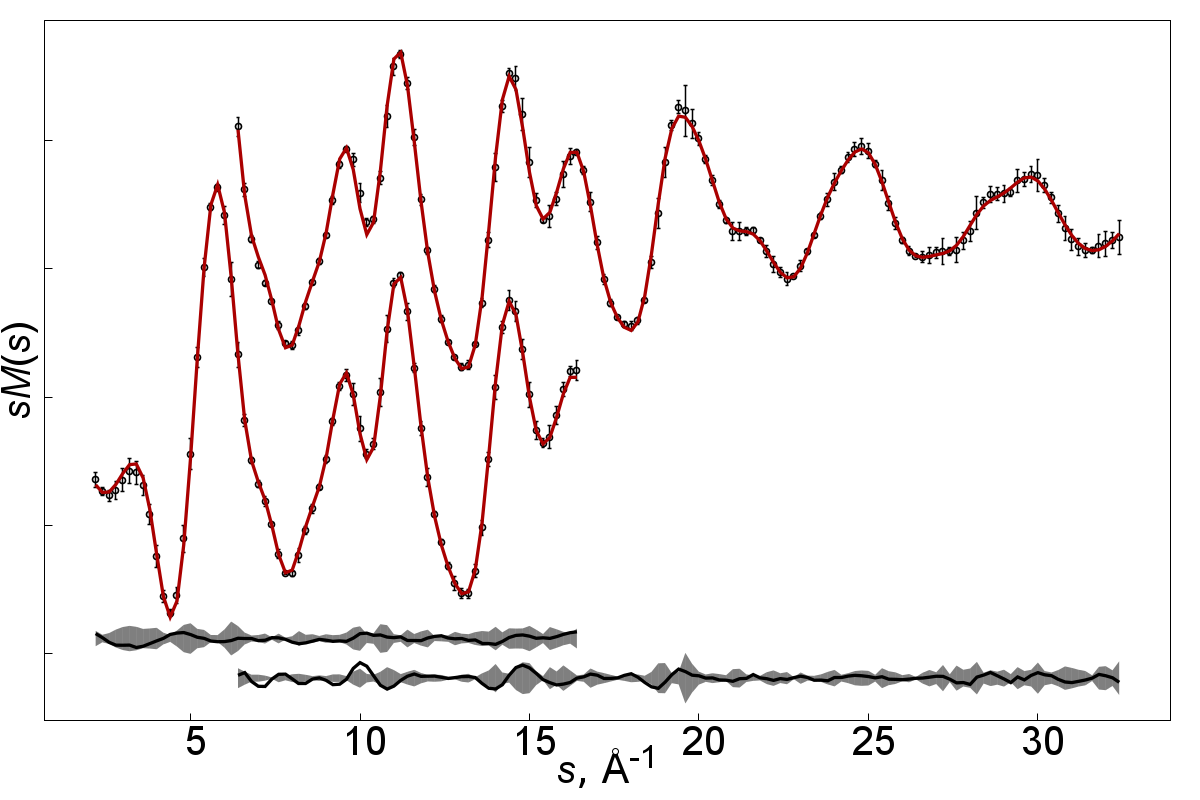
IntPlot v1.6-535. Experimental sM(s) are with error bars, on the bottom are residuals on the filled areas corresponding to errors. Errors are three times standard deviations.
intplot --cread 1-5,2-5 --ccombine 1-5,2-5 --dread sms,tsms,dsms,smss --dcombine sms,tsms,dsms,smss --no-legend --no-grid --no-x2tics --no-y2tics --elw=1.0 --smserrbars --smsef=3.0 --dsmslerrfill --png intplot1.png unex.out